
Skip to main content
How Can We Help?
Display online data
The Spincube User Interface provides two ways to monitor process data in real time:
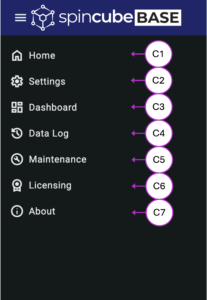
- Through the Dashboard view (Main Menu C3)
- Through the Data Log tab (Main Menu C4)
Real-Time Data on the Dashboard
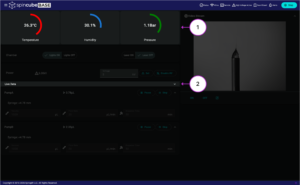
On the Dashboard layout, the current state of the Temperature, Relative Humidity and Hydrodrive Pressure is always visible at the top (1).
Live Data Panel
Additional real-time monitoring is available via the Live Data panel (2):
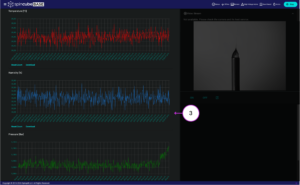
- Expanding this panel reveals short-term graphical trends
- The displayed graphs show the time-dependent variation of process parameters (3)
This view is useful for quickly assessing changes during an active experiment.
Data Log View
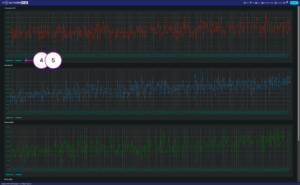 For more detailed analysis, open the Data Log tab (C4):
- Displays process data from the start of the system operation
- Allows long-term tracking of parameter changes
Graph Interaction
Within the Data Log view:
- Use the mouse wheel to zoom in on the graphs
- Click and drag (hold left mouse button) to pan across the timeline
- To return to the default view of the graphs after interaction, press the Reset Zoom (4) button
Data Export
The Data Log interface also allows downloading (5) recorded data from the graphs.
For further information, refer to the corresponding article on Data Export.